Selection
This tab allows you the select the stocks you want to include in your portfolio.
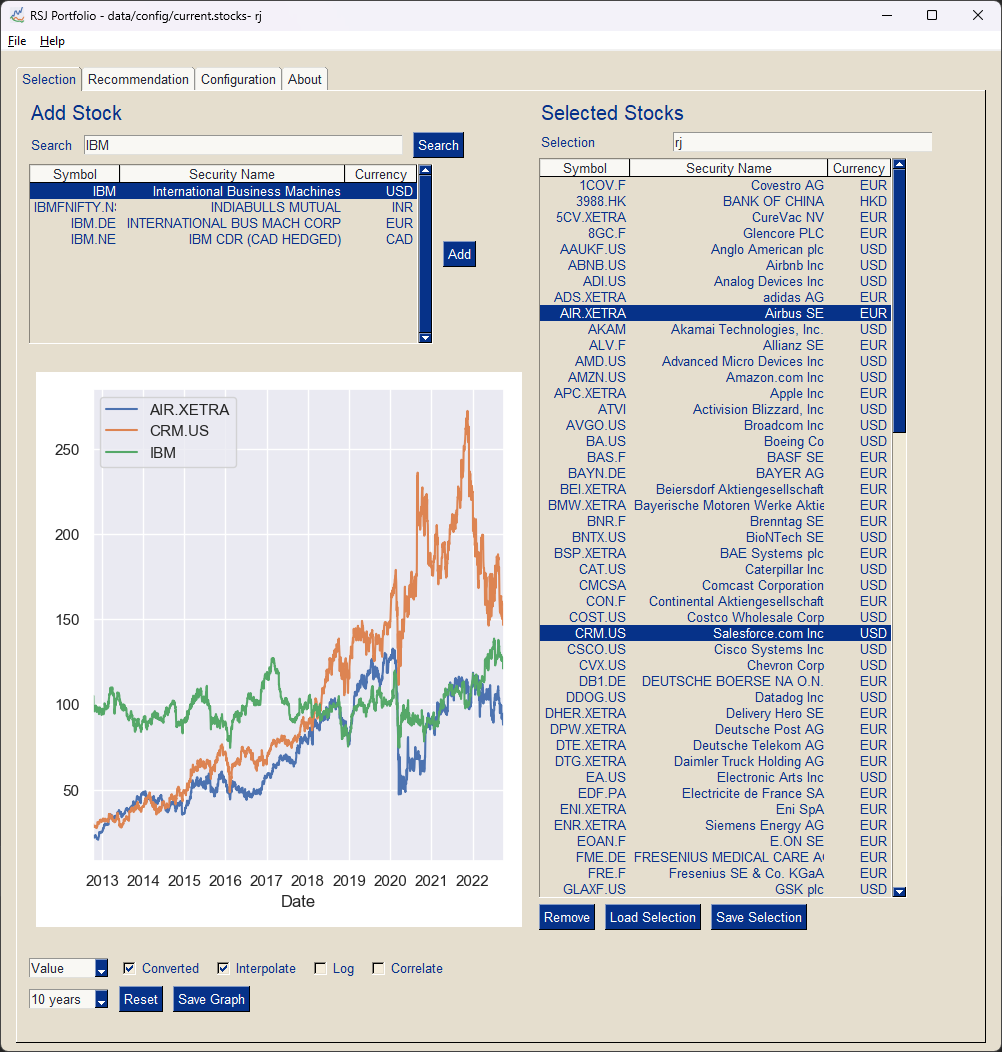
Use the search button to search for the correct stock symbol.
The selected stocks (in both stock lists) are plotted in the graphic according to the graphic options
Graphic Options
You can select the following options:
- Graph type:
- Price
- Relative Price (all stocks start with 100%)
- Change
- Interpolated: Fill gaps between prices
- Converted: Convert price to local currency
- Logarithmic: Use logarithmic scale
- Correlation: Show correlation between stocks
- Timeframe:
- 1 month
- 3 months
- 6 months
- 1 Year
- 2 Years
- 5 Years
- 10 Years